You have an idea of data then will go with the Shape of data.
The shape of data measured by
1.Skewness
2.Kurtosis
1.Skewness (Symmetry):
Measures look at how lopsided distributions are how far from the ideal of the normal curve they are when the median and the mean are different, the distribution is skewed. The huge difference is the difference skew.
If the skewness is extreme, the researcher should either transform the data to make them better resemble a normal curve or else use a different set of statistics

Indicators of Skewness:
Frequency curve is not symmetrical bell-shaped and the sum of positive deviation is not equal to the sum of negative deviation
Finally, it measures of asymmetry of data.
Positive or right skewed: Longer right tail
Negative or left skewed: Longer left tail
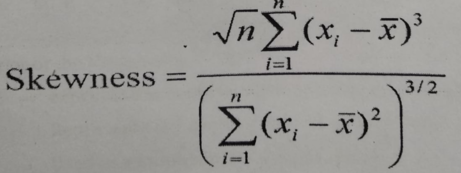
Let x1, x2, x3…..xn be n observations. Then
Kurtosis :
It is a measure of the “taildeness” of the probability distribution of a real-valued random variable. And it is concerned with the degree of Flatness in a curve.
Kurtosis is a shape of a probability distribution and, just as for skewness, there are different ways of quantifying it for a theoretical distribution and corresponding ways of estimating it from a sample from a population.
These three are Kurtosis prototype shapes.
1. Leptokurtic: A curve which is more peaked than the normal
2. Mesokurtic: A normal curve is called as a mesokurtic curve.
3. PlatyKurtic: A flat curve than normal is called platykurtic.

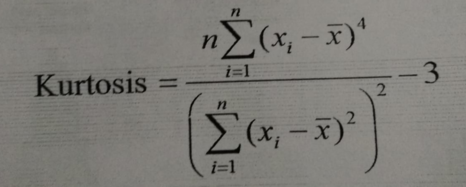
Kurtosis Formula:
Let x1,x2,x3…xn be n observations. Then,