In Artificial Intelligence Distributions are more important for the table of contents, here we will explain different types of distributions.
Types of Distribution in Artificial Intelligence:
1.Bernoulli Distributions
2.Uniform Distributions
3.Binomial Distributions
4.Normal Distributions
5.Poisson Distributions
6.Exponential Distributions.
1. Bernoulli Distributions:
Let’s start with the simple distribution that is Bernoulli distribution. It is actually simple to understand for Artificial Intelligence learners.
For example, we will take cricket addicts out there! At the time of the beginning of any cricket match, how do you decide who is going to bat or ball first? It all depends on toss. Whether you win or lose the ross, right. Likewise, this distribution is worked in the probability
This distribution has only two possibilities a one is a success and failure. Here 1 indicates that success and 0 indicate that failure. we will take random variable X which has take value 1 with the probability of success. And another occurrence of head denotes success and the occurrence of tail denotes failure. Probability of getting ahead = 0.5
The probabilities of success and failure need not be equally likely, as the result of a fight between you and the opponent. He is pretty much certain to win. So in this case probability of my success is 0.15 while my failure is 0.85
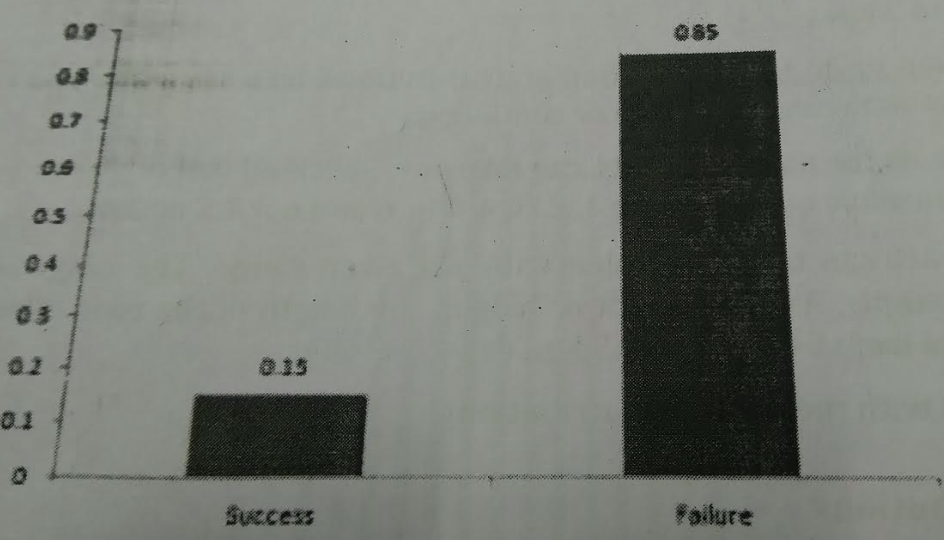
Here the probability of success = 0.15 and probably of failure = 0.85 The expected value is exactly what it sounds.
E(X) = 1*p + 0*(1-p) =p
The variance of a random variable from Bernoulli distributions is
V[X] = E[X^2] - [E[X]]^2 = p - p2 = p(1-p)
There are many examples of Bernoulli Distribution such as whether it’s going to rain tomorrow or not where rain denotes success and no rain denotes failure and winning to the game.
Uniform Distributions:
The uniform distribution will explain a real-time example, take a die and roll will get the outcomes are 1 to 6. The probabilities to obtain these outputs are the same likely and that is the basis of a uniform distribution.
A variable X is said to be uniformly distributed if the density function is:
f(x) = 1/b-a
The graph of uniform distribution curve looks like below snapshot
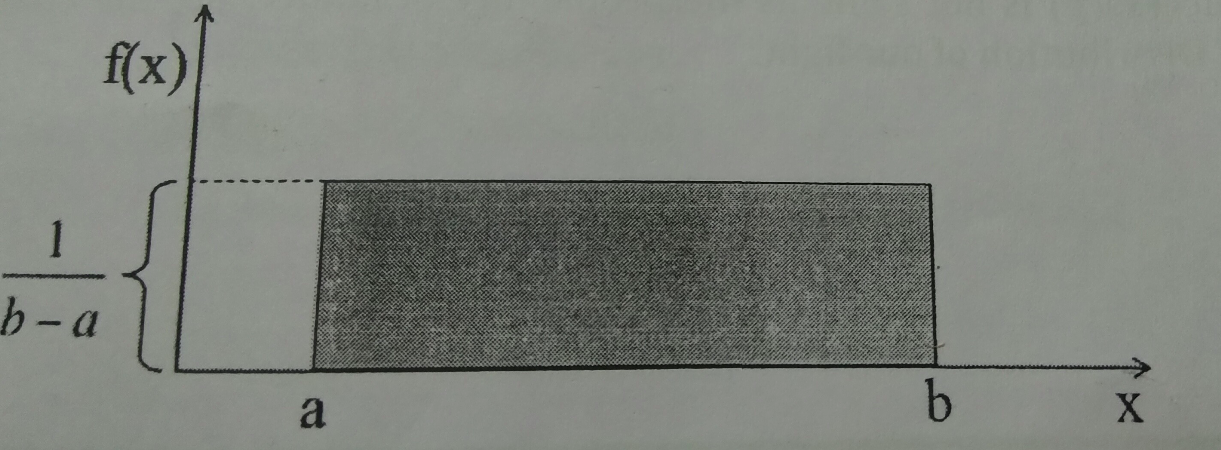
For uniform distribution, a and b are the parameters
Let’s try calculating the probability that the daily sales will fall between 20 and 40
The probability that daily sales will fall between 20 and 40 is (40-20)* (1/(60-30) = 0.6
Mean E[X] = [a+b]/2
Variance V[X] = [b-a] ^2 /12
The standard uniform density has parameters a =0 and b =1. so the PDF for standard uniform density is given by:
f(x) = {1, 0<= x <=1 , 0 other wise}